Core Web Vitals for Google rankings
Last updated: 11 November 2020.
Google announced that in 2021 the Core Web Vitals metrics will join other user experience (UX) signals to become a ranking signal. Google has long used page speed as a signal, and the new (and different) approach in this signal uses data measured directly by Chrome on users’ desktop and mobile devices. This ranking change along with SERP UI changes will launch in May 2021 – details for both below.
This page is a deep-dive into how this data is collected, what it means for users, for your business, for SEO (ranking) purposes, and what you need to do about it. This is a technical topic at heart that touches on many disciplines. It is likely going to require people from different teams, including product, marketing, engineering, and design.
But before we dig in, let’s answer the question: Does this change impact your site enough for you to care?
How to decide if your site’s current page experience is an immediate priority
First and foremost, it’s going to be a tiny ranking signal, but rankings are not the only reason you should take this seriously, now or in the near future as I explain below.
By labelling the change as a “tiny” signal, I mean that for the vast majority of queries, there is not going to be a noticeable impact, if any at all. Why I think this is the case is explained below.
Expanding a bit: there are many ways to think about this. My approach is to look at the two important facets:
- Keywords competition
- If your website mostly attracts brand queries and you have no interest in growing more non-brand organic search engine traffic, then you can probably ignore this purely for the SEO benefits.
- If your website attracts (or you want it to attract) traffic from a large number of non-brand queries on organic search, then you absolutely need to pay attention for reasons I detail below, and this article is for you; I expand on this argument below.
- User experience: Much more important than keywords is the user experience. This is a big topic, but I will summarize for our purposes as: Does your website help your users achieve what they want efficiently?
With that in mind, if you have not paid much attention to your website’s user experience recently, this is a good time to start.
However, if you have consistently placed customer experience as a high priority for your business, and actually consistently improved speed and UX metrics, then you are probably already doing work that improves these metrics anyway. Your task now would be on making sure your results are reflected in the metrics that power the ranking change, and that additional work is not still needed.
How to determine if Google thinks your page experience needs to improve
The data source you should consider specifically for SEO and the ranking change Google announced: the Google Search Console Core Web Vitals report. If the vast majority of your pages are considered slow in this report, then it is likely that something fundamental to how the website operates is broken, and it’s worth taking a closer look. I talk in more detail about this report in a dedicated section below.
What are the Core Web Vitals metrics?
Web Vitals is a multi-year effort by the Google Chrome and web platform teams to define a set of metrics that measure whether a webpage offers a good user experience or not. This article from the Chrome team explains it really well.
Core Web Vitals is a subset of the Web Vitals metrics that apply to all pages, regardless of whether they are an article, an image gallery, or a single page app. Of course, it is likely you track other metrics specific for each page type on your site, but this is outside the scope of this article.
Specifically for page speed, the metrics address two criteria:
- How fast users perceive the page loads
- Measurable on all device types
User-centric metrics
The critical point about user perception is often misunderstood. There is a large psychological component to page speed, in that a page that loads slowly could be perceived to be faster by people. To illustrate briefly, lazy loading content that’s below the fold is done to engage the visitor with above the fold content as fast as possible, while the rest of the page, which may be slower to load, continues loading in the background. Clearly the total page size and number of page assets does not change, but by changing how the page loads, users perceive it as faster, and it is thus a better experience.
This psychological component has always been a problem for the speed metrics commonly used in the past. To pick on one commonly “mocked” punching bag metric, consider “time to first byte”. It’s obviously important to get the rendering process started promptly, but this metric doesn’t tell you much about how fast the page loads for users.
This is why Web Vitals focus on user-centric outcomes.
Currently, there are three metrics called Core Web Vitals targeting different facets of how user perception of how good the page experience is. These are:
- Largest Contentful Paint (LCP): as a measure of loading performance
- First Input Delay (FID): to measure if the page is interactive and responsive vs being perceived as “hung” or “stuck”
- Cumulative Layout Shift (CLS):to measure visual stability such that content is not perceived as “jumping around” the screen too much
I will not go into the technical details and trade-offs of each here because Google’s Web Vitals website does a great job.
Page experience is not just about speed or rankings
With all that said, speed is just one of a group of signals Google is calling the “page experience”. A page’s experience has a much more important role in terms of conversions and user happiness. Speed, and all the other component page experience signals, are user-centric.
Actively working to improve these metrics will improve the effectiveness of your website, conversion rates, and you get a ranking boost cherry on top of the user experience cake. There are many public case studies about the business impact of improving the website; a good collection is on WPO Stats.
Page experience as a ranking signal
I’m now going to generalize and talk about “page experience” – the group of signals of which page speed is just one component.
How is page experience used in search ranking? Here we have to tread carefully.
First and foremost, even though my assessment is that it’s not going to have a large impact on rankings, depending on your business goals, the vertical in which you operate, and your web search competitors, the impact to your business could be significant.Why do I say it is a tiny signal? Google told us! There are many, much more important signals, namely those for assessing relevance and quality. Here is the key quote from the announcement blog post:
While all of the components of page experience are important, we will prioritize pages with the best information overall, even if some aspects of page experience are subpar. A good page experience doesn’t override having great, relevant content. However, in cases where there are multiple pages that have similar content, page experience becomes much more important for visibility in Search.
Google Webmaster Central Blog, 28 May 2020
To rephrase and simplify: if the most relevant page for a query is slow or otherwise offers a suboptimal (or outright bad) page experience, the page will still rank well, at number 1 even. Good content pages will rank well despite having a bad page experience signal.
Where page experience becomes a little more interesting for ranking is when all other signals say two pages are about the same in terms of relevance and quality, and their respective page experience signals could play a tie-breaking role. How often that happens is not public, and you can guess it’s probably for non-brand, generic, highly-competitive queries. Any ranking gains to be had in these (common) circumstances is why many of my clients are taking this announcement seriously.
What is the page experience signal, exactly?
We don’t know, what we don’t know.
The first unknown: Google web search has not stated how the CrUX metrics will be used.
The CrUX numbers are classified into three categories: Poor, Needs improvement, or Good. Note that unlike page speed metrics, these categories are defined with hard-coded thresholds, not percentiles. If these categories (or similar) are how the ranking signal is defined at heart, then you can imagine it being implemented in different ways. I doubt we’ll ever get this level of detail from Google, and, ultimately, it’s not that important.
The second unknown is whether the signal is site-wide, by page type, or per-page. My strong inclination is that it is by page type not by page or by site signal, for two reasons:
- Not all pages would have enough traffic to get statistically meaningful numbers. These could be new pages, they could be not that popular even if they are good pages (for example if they are super relevant to topics/queries that are just not that common).
- The Web Vitals report in Search Console is based on groups of URLs, namely URLs detected as having the same type of user experience.
The third unknown is how, or if, the data will be segmented by user location, or, ideally, the user’s network speed. We know that different regions within a country and different countries can have greatly different internet connection speeds. If you live in a city, you know exactly what happens to mobile connections when you drive out to the country or go into some buildings.
We know that Google measures a user’s connection speed (at the very least for the decision whether to transcode pages for Web Light on mobile), so it is possible that the signal is user-specific in some way. That would be overkill in my opinion, but it is a possibility. If it turns out that it is user-specific in some way, there are many (many!) interesting business and technical questions to think about, and I’ll cover those if we ever get a hint this is the case.
What we can be sure of is that it will be device-specific, i.e. mobile and desktop will have their own metrics. CrUX (and thus Search Console) segments this data, and no competent web performance practitioner would ever aggregate desktop and mobile numbers.
How are Web Vitals measured?
The Web Vitals metrics are measured by the browser as the page loads. The browser for Google ranking purposes is Chrome, on desktop and mobile.
The Core Web Vitals metrics are shared with Google by Chrome when the measurement happens by a browser and the user:
- is logged into Chrome; and
- has opted-in to syncing their browsing history; and
- has not set up a sync passphrase; and
- has usage statistics reporting enabled.
This is a subset of a subset of a subset of a subset of all users. Chrome’s market penetration varies around the world, by device, and varies for each website – meaning what percentage of your website visitors are sharing these numbers is different from another website.
We can estimate it as follows (sorry to get all McKinsey on you): in aggregate globally across all devices, Chrome has roughly 65% market share (but be careful it’s higher on mobile). Of all Chrome users, many will not be logged in, but I would hazard a guess and say it’s a small percentage. And of all those logged in, we want them to have taken steps to allow Google to have this data. If you make some assumptions, Web Vitals metrics come from roughly half of web users, and on mobile it will be higher.
Importantly, even if the user does not share the data with Google, your own analytics can (and should) still record the metrics directly into your own data pipeline. How to do this is for a different day, but some suggestions are listed below.
Measuring page experience (and other) metrics yourself
For one-off tests or for a small number of pages, you can do it manually using tools such as Lighthouse and the Web Vitals Chrome extension.
But I’d like to emphasize the importance of doing your own measurements at scale, as there are many advantages:
- The data is real-time. CrUX updates once a month with the data about the previous month. Real-time data allows you spot issues and respond faster, before they become problematic for your own users and negatively impact rankings.
- You can segment the data as your business needs it. For example, you can segment by
- User type, like logged-in vs logged-out, or new vs repeat
- Page type, like product landing pages and category pages on an ecommerce website.
- You can blend with other data, like conversions, and then plot a graph that tells you the financial value of each drop in a page experience metric so you can prioritize your work (these graphs are business gold!)
- There are other page experience metrics (speed or otherwise) that are important, so having them all in one reporting dashboard makes life easier for the different stakeholders within the business.
- Your implementation is highly unlikely to be blocked by content blockers (see dedicated section below), meaning you get the full data set like CruX would, not the subset of users who do not have an ad or tracker blocker installed.
If you don’t have your own measurement pipeline, please get in touch. I do this regularly for clients. Yes it’s more infrastructure, but it’s worth it in the long run.
Of course there are third-party tools/platforms that already do this and, for example, Google’s Web Vitals website shows you how to send the data to Google Analytics. Many of these tools are already blocked by content blockers, so you will not be getting a complete view of your data. Test very carefully if you go down this path.
How Core Web Vitals are reported
Chrome User Experience Report
Web Vitals metrics collected by Chrome are publicly available for any web origin in the Chrome User Experience Report (abbreviated as the CrUX report), if the origin is already known to Google search indexing (the public face of which is Googlebot), and if the origin has enough traffic.
The fact it’s aggregated by origin is very important to keep in mind as you look at the data; a reminder how a web origin is defined. The details of aggregations are critical in this line of work.
You can access the data using Search Console (see next section), Pagespeed Insights or a BigQuery table. There are tools built on top of these, such as a Data Studio connector, and you can build your own.
Search Console Core Web Vitals Report
This is one of the easiest reports from Google about the data, which you can find here.
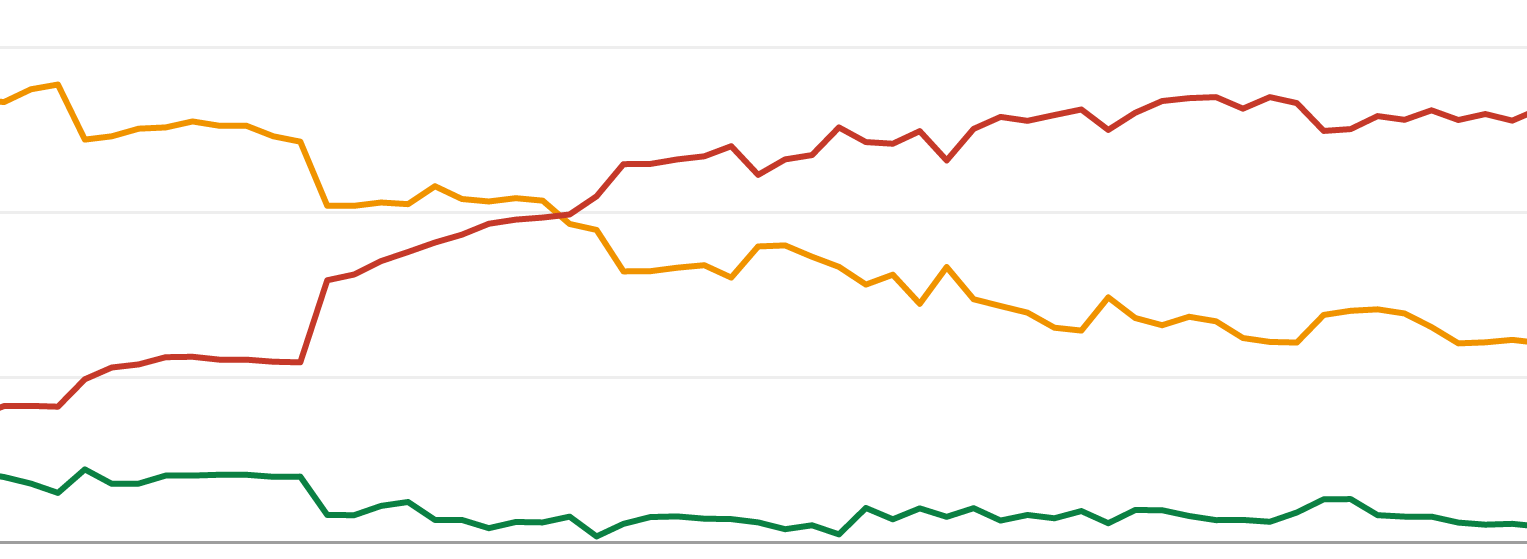
Your goal when looking at this report is to assess two things:
- If a large percentage of your website’s URLs are considered “Poor” (red line) or “Need improvement” (orange line).
- The historic trends leading to the latest/current data point.
For example this graph clearly communicates that the website is getting slower over time, as well as having a large portion of its URLs considered Poor. The website really should look at what is going on.
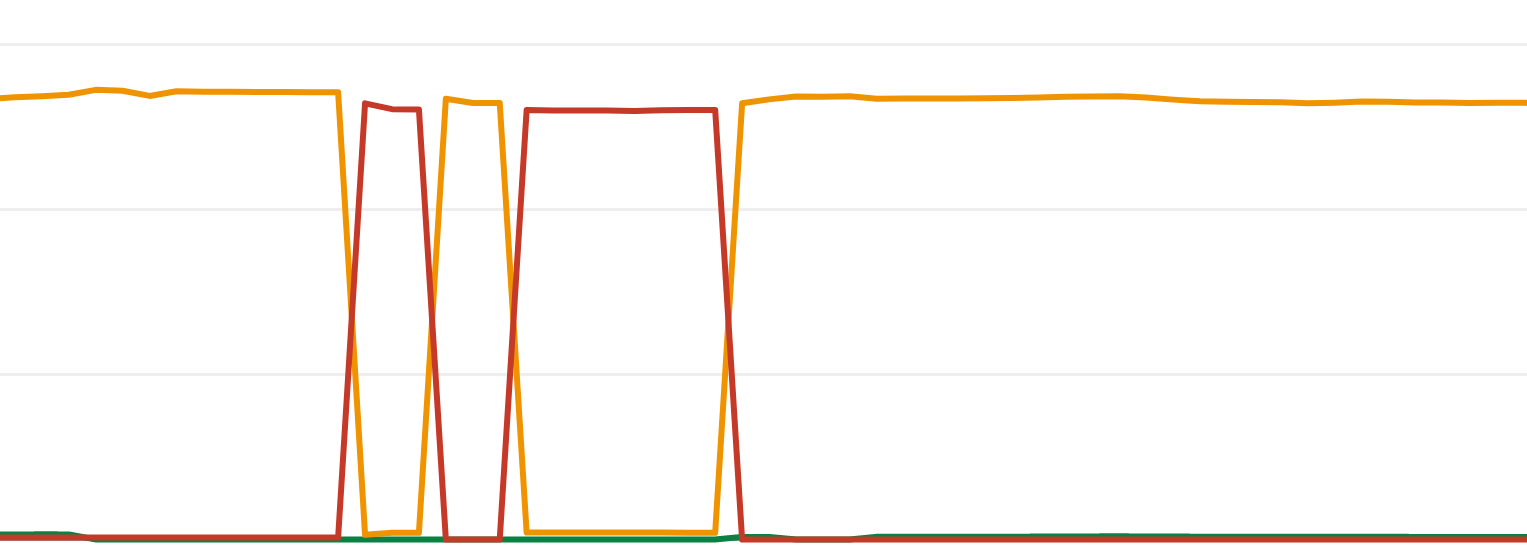
Another important issue to flag is to check if your URLs keep flip-flopping between classifications as that may point to something wrong with your infrastructure or that your visitor mix is changing. Investigating this can be an exercise in patience and nitty-gritty analysis, but the results have always been extremely valuable to my clients when we did it.
Speed “visual indicators” in the SERP
In the announcement specifying when this change will launch, Google said “we are working on one that identifies pages that have met all of the page experience criteria“. This is a huge deal.
Any time the result’s display in the SERPs changes, the clickthrough rate (CTR) can change. I intentionally use the word “result’s display” because what is involved is the title and snippet (featured, rich, structured, or plain text snippets). Whether it’s the title or snippet or something else, we are very likely to see a change. Some changes are positive, and some negative, and some are drastic. This means that any change can increase or decrease the total traffic a page gets even if that page’s ranking does not change.
Google is will be adding a visual element to signify that the page is “fast”, and the design of that is still to be determined. This is not the first time Google has tested something like this. Back in 2014, the SERPs tested icons that a page is mobile-friendly and icons signifying that the page is mobile-unfriendly.
Of course the visual indicator could be text, similar to how ads have long been marked in the SERPs. The CTR is still going to be affected, and it may even be confusing to users if it appears to be part of the website-provided content like the title or snippet text.
There are four things to consider here:
- Is the visual indicator a positive one or negative? Is it signifying that the page is “fast” or “mobile friendly” or is signifying the page is “slow” or “unfriendly”?
- Will all results on the SERPs get this visual indicator? Why or why not? Obvious this depends on whether it’s a positive or negative indicator, but the coverage will be critical.
- How responsive is this indicator to a site’s speed changing? If a site has a slow indicator and makes a change to be fast today, how long will it take for the indicator to change?
- Will it be on all devices (desktop and mobile) or will it be based on the searcher’s perceived internet speed?
- Human psychology.
The last point is very important: Will people even understand what this indicator is about, and will that affect their behavior?
Assuming people do actually make the connection that the indicator is about page speed (that’s a huge uncertainty, but assume it works for now), what we know is that different people can interpret the same indicator differently. The difference in interpretation could be personal, it could be cultural, or contextual (e.g. the query), or it could be something else entirely. There is a good reason hieroglyphics are not that common as a language these days, yet Google is promising to bring them back.
Of course if the visual indicator could be a color difference. That’s still a big can of worms.
Critically, as a website owner, be ready for a possibility that the CTR will be turbulent in the next few months as Google experiments, and be ready for a decrease in CTR even if your website is fast and rankings do not change.
Miscellaneous topics
Content (ad) blockers
This is a complicated topic with many nuances and branches in logic. I cannot do it justice here but I can give you a mental model to help decide if you need to focus on it or not.
Top-level litmus test: if your website attracts many different non-overlapping audiences, this is something you need to be concerned about; otherwise, you can probably ignore this section.
The important points to note are:
- Core Web Vitals data collection by Chrome is not blocked by any installed content blocker because it’s the browser doing it out of band.
- Content blocking improves all the Web Vitals metrics. How much of an improvement depends on the blocking lists the user has enabled and the webpage itself. From my direct measurements while operating Blockmetry, a tracker-blocking browser (one that has uBlock Origin installed for example) typically loads a page about 40% faster on average. This is huge.
- Content blocking behavior varies for each audience you attract to the site.
- The same audience you attract visit your competitors’ websites too and they get the same benefit.
What do I mean by “different non-overlapping audiences”? Take an example of a news website with multiple sections like sports, business, travel, and technology. The issue is that each section attracts a different audience that behaves differently in terms of content blocking, but all audiences affect the whole website (the origin). What is the outcome of this dynamic is not a simple question to answer and I can walk you through it.
If you’re stuck, please get in touch.
Dynamic rendering
Remember that CrUX data comes from users’ browsers, your website visitors, not what Googlebot sees. Therefore even if you serve your content using dynamic rendering just for crawlers like Googlebot, you are not off the hook.
This sometimes raises interesting situations, like if your dynamically-rendered static HTML page is fast but users do not see a fast page. You need to ignore the fact that you’re using dynamic rendering and focus on the experience of normal browsers.
Accelerated Mobile Pages (AMP), Top Stories, and Core Web Vitals
Until this ranking change launches, Google is continuing to force publishers to use AMP in order for their content to be eligible to be shown in the Top Stories search feature. In a major step forward, the ranking change will remove this requirement. However – and this is the key point – how much of a change that’s going to be in practice remains to be seen. There is a huge difference between saying all pages are eligible and actually showing non-AMP pages in meaningful numbers in the search results features.
Immediate next steps
Firstly, thank you for reading this far 🙂
Secondly, the question of when: May 2021 as Google announced in November 2020.
Thirdly, and more tactically:
- If you only care about SEO, Core Web Vitals are all you need to focus on. But more likely, you would need to take this topic more broadly, and I urge everyone to think about instrumenting real user measurement (RUM) on their websites. Obviously this is not usually a quick or small undertaking, so here is what I advise my clients:
- If you have done “nothing” meaningful about page speed in the past year or so: Focus on Core Web Vitals for now, get ahead of the SEO implications, and then look at more metrics and user experience enhancements in the future.
- If you have been paying attention and actually responding to “some” page speed metrics, look at how we can integrate and prioritize Core Web Vitals into the current reporting if you’re not already doing so. Of course prioritize responding to the Core Web Vitals metrics, and expand on the existing infrastructure in the future.
- If you’re completely on top of page speed, just check that you’re not missing anything.
- If, after you reviewed the content blocking section above, you decide content blocking is a concern, get in touch. This could be a serious issue that you can turn into a competitive advantage.
And of course, any questions: [email protected].
Thank you to all my clients who asked these questions, their review of this document that helped it get better for everyone. Also thank to all my industry friends who helped in small and big ways, especially Michelle, Jan-Willem, Adam